


Chennai, July 2021: Knight Frank India, a premium international property consultant, in their flagship market assessment report “India Real Estate January – June 2021” – that evaluates the performance of residential asset classes in top eight markets of India – cited that Chennai recorded a 93% YoY increase in residential demand in the first half of 2021 as sales jumped from 2,981 units sold in H1 2020 to 5,751 units sold in H1 2021. Further, new project launches grew by 54% to 5,424 units in H1 2021.
CHENNAI MARKET SUMMARY
| Parameter | H1 2020 | H1 2021 | Change (YoY) |
| Launches (housing units) | 3,520 | 5,424 | 54% |
| Sales (housing units) | 2,981 | 5,751 | 93% |
| Price (weighted average) | INR 44,509/sq m (INR 4,135/sq ft) | INR 43,619/sq m(INR 4,052/sq ft) | -2% |
| Unsold inventory (housing units) | 14,149 | 11,862 | -16% |
Note: 1 square metre (sq m) = 10.764 square feet (sq ft)
Source: Knight Frank Research
On the demand front, South Chennai accounted for the largest share, 56% of the total units sold in H1 2021 followed by West Chennai with a 34% share. The INR 2.5-5 mn and the INR 5-7.5 mn ticket-size categories emerged as popular choices during this period. Further, the demand for spacious homes and second homes has picked up in the last few months on account of the pandemic-induced work from home and digital studying trends.
CHENNAI TICKET-SIZE SPLIT OF H1 2021 SALES
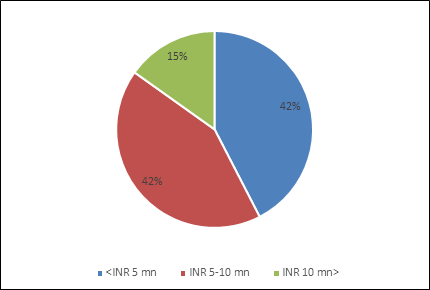
On the supply front, 5,424 units were launched in H1 2021 recording a 54% YoY increase. West and south Chennai together accounted for 98% of the total H1 2021 launched units. In terms of ticket-size split, developers continued to focus on the affordable housing segment, especially in the INR 2.5-5 mn category.
Srinivas Anikipatti, Senior Director – Tamil Nadu and Kerala, Knight Frank India said, “The second wave which was much deadly than the first, has partially affected the economy. The second wave has shown the bottom level of price reduction of residential real estate in Chennai. This bottoming out of prices has driven many who were on the fence, to conclude with a home deal. The affordable and mid segment continues to be a major demand driver in Chennai. The city is witnessing an increasing demand for second homes and spacious homes owing to the work from home and study from home trends.”
Prices in Chennai’s residential real estate market recorded a marginal decline of 2% YoY in H1 2021. However, sequential comparison of half-year periods indicates a 7% HoH growth in H1 2021 which is largely attributable to the recovery in prices during the festive quarter of Q1 2021.
QUATERLY LAUNCHES AND SALES TREND
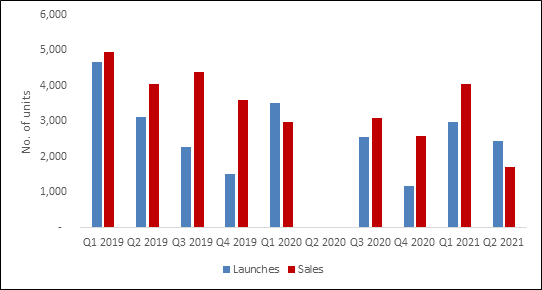
Source: Knight Frank India Research
Note:
COVID-19 disruptions in market activity led to a standstill in sales activity at residential project sites and registration offices during Q2 2020. In some cases, customers paid nominal amounts on application for housing units, which could be identified and allotted later. Such instances of transactions with limited details on booking have not been considered in the Q2 2020 numbers. With more details awaited on certainty of such transactions, the recording was deferred and the same has been captured during the next quarter.
RESIDENTIAL PRICE MOVEMENT IN SELECT LOCATIONS
| Location | Micro-market | Price range in H1 2021in INR/sq m (INR/sq ft) | 12-month change | 6-month change |
| Anna Nagar | Central | 110,800-125,000 (10,200-11,600) | -4% | 2% |
| Kilpauk | Central | 151,000-167,000 (14,000-15,500) | -3% | 3% |
| Porur | West | 54,900-61,400 (5,100-5,700) | -1% | 7% |
| Mogappair | West | 64,600-72,100 (6,000-6,700) | -1% | 6% |
| Kolathur | North | 44,000-58,000 (4,100-5,400) | -2% | 3% |
| Perambur | North | 61,400-70,000 (5,700-6,500) | -2% | 4% |
| Perumbakkam | South | 43,000-48,400 (4.000-4,500) | -2% | 5% |
| Kelambakkam | South | 34,400-42,000 (3,200-3,900) | -2% | 5% |
Source: Knight Frank Research
Micro-market classification – H1 2020 Vs H1 2021:
| Location | Micro-market | H1 2020 | H1 – 2021 | ||
| Sales | Launches | Sales | Launches | ||
| T. Nagar, Alandur, Nungambakkam, Kodambakkam, Kilpauk | Central | 57 | – | 351 | 74 |
| Porur, Ambattur, Mogappair, Iyyappanthangal, Sriperumbudur | West | 1275 | 1562 | 1932 | 3011 |
| Tondiarpet, Kolathur, Madhavaram, Perambur | North | 37 | – | 235 | 40 |
| Perumbakkam, Chrompet, Sholinganallur, Guduvancheri, Kelambakkam | South | 1613 | 1958 | 3234 | 2298 |
Source: Knight Frank Research
Micro-market Health
| Micro-market | Unsold Inventory (housing units) (YoY Change) | Quarters-to-sell (QTS) (In quarters) | Age of Inventory (in quarters) |
| Central | 587 (-29%) | 4.5 | 17.2 |
| North | 408 (-35%) | 4.2 | 19.8 |
| South | 6,041 (-26%) | 3.3 | 17.5 |
| West | 4,826 (6%) | 6.4 | 14.9 |
Source: Knight Frank Research
Notes:
1. Quarters to Sell (QTS): The number of quarters required to exhaust the unsold inventory is termed as the QTS of a particular market. It is calculated by dividing the unsold inventory by the average sales of eight trailing quarters from the end of the analysis period.